Swedish Muslims
1970 1,000 1980 30,000 1985 50,000 1988 100,000 1990 120,000 1992 140,000 1994 160,000 1996 200,000 1998 250,000 2000 325,000 2005 375,000 2006 400,000
Table 1. Estimated Muslim population (1970-2006) [i Sverige]
Source: Sander and Larsson
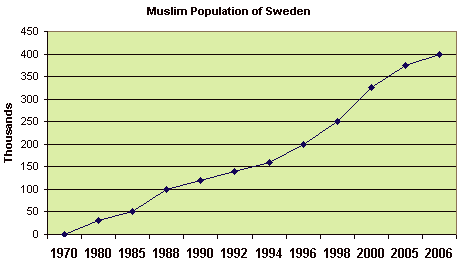
When I looked at those figures, my natural inclination was to plot them in a graph. Here’s the result:

At first glance this graph shows a steady growth, which may or may not be alarming to the average Swede. However, that growth appears to be a simple linear trend, with the figures rising in more or less a straight line.
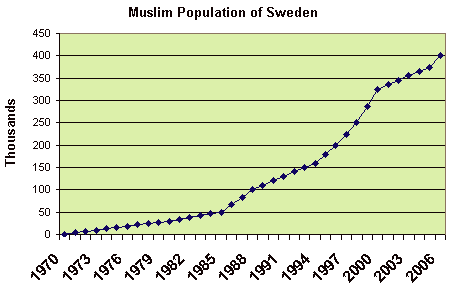
But this graph is deceptive. The number of years between successive population figures is much greater in the earlier part of the table than it is for the more recent figures. To make it easier to see the trend in the graph, I added the missing years and inserted the estimated population as a standard proportional interpolation. That makes the graph look quite different:
- - - - - - - - -

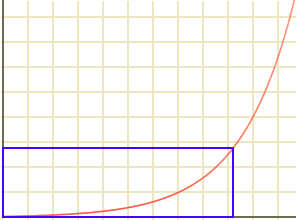
The revised graph does not show a linear trend. It’s too early to tell for sure, but that looks like an exponential curve to me. Here’s an example of an exponential growth curve:

The rectangle marked in blue represents the period shown in the second population graph. As you can see, in the coming years the curve rapidly steepens.
An exponential increase means that the population doubles within a certain fixed period. Suppose you started at 1980 with 30,000 (the same figure as in the actual statistics) and doubled it every 6.7 years. The resulting population table would look like this:
| 1980 | 30,000 | |
| 1987 | 60,000 | |
| 1993 | 120,000 | |
| 2000 | 240,000 | |
| 2007 | 480,000 | |
| 2014 | 960,000 | |
| 2020 | 1,920,000 | |
| 2027 | 3,840,000 | |
| 2034 | 7,680,000 | |
| 2040 | 15,360,000 | |
| 2047 | 30,720,000 |
These figures come close to the actual numbers listed since 1980. If the trend continues, since the population of Sweden in 2007 is estimated to be between 9 and 10 million people, within about thirty-five years there will be more Muslims than “persons of Swedish origin” in the country. And this is assuming that there is no further emigration from Sweden of the native population.
Obviously, the future demographics will not really look like this. Even if the rate of increase actually is linear, and not exponential, something will change — either Sweden will resist further Islamization, and the Muslim population will stabilize at a lower level, or Sweden will succumb. In the latter case the numbers will stabilize at a population which can be supported by a slave-based feudal economy within the land area available.
The population fluctuations for any species in a real ecosystem exhibit chaotic characteristics. In the typical case, there is an initial slow start, with an exponential growth curve causing an explosive increase after a certain amount of time. Then the limiting factors kick in — exhaustion of the food supply, an increase in natural predators, disease through overcrowding, and so on. After that, the population crashes, and the process begins all over again with the survivors forming the nucleus of a new population explosion. The resulting cycles, being chaotic in nature, are generally not predictable.
Other limitations on exponential growth may appear as a result of the way the data are defined. For example, consider the increase in illegitimate births in the United States. Over the last forty years or so the increase of illegitimacy has exhibited the characteristics of exponential growth. In recent years, however, that increase has slowed.
Is that because young Americans are becoming less promiscuous and more responsible? No; it’s because the proportion of illegitimate births, at least in certain subgroups, is approaching the natural limit of 100%.
Both examples illustrate the fact that an exponential growth trend cannot continue past the carrying capacity of the environment in which the growth takes place.
In Sweden’s case, the limiting factor which will define the county’s carrying capacity for Muslim immigration has not yet become apparent.

8 comments:
This is excellent...
and Baron, now you are two in the world,
you yourself and Sir Heny Morgan.
Thank you! This is true & pure information.
- - - - -
http://sirhenrymorgan.blogspot.com/
http://gandalf-reconquista.blogspot.com/2006/11/have-you-daughter.html
rather than exponential growth reaching a breaking point, consider the Logistics curve. It levels off at a higher level due to restricting parameters.
Very interesting, though I´m not int higher mathematics.
I will just add, that the figures and the source are reliable, AND that the figures probably are a bit on the conservative side.
No one knows the exact number om muslims - some even guess higher than 500.000 at the moment.
Although I can't really say much about the effects of an increasing muslim population in Europe, I will point out a few things about your analysis of the population growth, although maybe you should take my points with a grain of salt as I'm only an engineering student, rather than a statistics expert. Firstly, rather than trying to estimate intermediate population figures, maybe you should have tried to fit a function to the orignal data, perhaps using excel's trendlines or a moderately good graphics calculator, which would allow you to calculate the r^2 value of the fit (a measure of how accurate the fit is to the data). This would have showed you that an exponential function is probably not the best fit, and is actually worse than a linear fit in terms of closeness to the original data, although the difference isn't much (r^2 values of .87 and .88 respectively), and the fits are even worse (.75 and .81) if you force them through the point 1970,1000. On the other hand, a second order polynomial (of the form ax^2+bx+c) has an r^2 value of .985, a very close fit to the original data. I tried to do a logistics regression, but my TI-83+ calculator had an overload and gave up. One thing I should point out though is that the r^2 value is only an indicator - if you have two pieces of data a straight line will give a perfect r^2 of 1, even though any function can potentially fit them, which brings me to my second point, that you need to chose an appropriate function in the first place. Choosing an exponential fit may not have been the right thing to do, as it only takes into account population growth through births and/or immigration that is also proportional to the population. Since there is no guarantee that immigration is proportional to the population, a function of the form e^x+a or e^x+ay where y is some other dataset (perhaps unrest in the middle east?) may better approximate the data. Anyway, that's my 2 cents worth, and as I mentioned before, take it with a grain of salt as I'm no expert.
NELCON, skidget --
I'm well aware that an exponential curve is not the best fit for the data. I tried to make that clear. Actually, a polynomial does look like a better candidate.
But that wasn't my point.
My point was that, for a while, a population may grow exponentially. Population dynamics generally show an almost perfect exponential increase during the early stages, when food is abundant and predators absent. But that's only for a while.
The "exponential curve" was a way of getting at my point, which is that, one way or another, such increases can't continue. Things will change, and this will happen even if the growth rate were linear.
My Dear Baron,
Indeed, I understand fully the central point you are making. Skidget and I both happen to be Engineers. We are both estimating the rate of flooding on the Titanic in order to develop an equation to determine the point at which the last bit of superstructure will flip none too gracefully beneath the waves, but, by the way, THE WHOLE DARN SHIP WE'RE ON IS SINKING!!! Believe me, I devote much more time to spreading the word about Islamic Fascism and Jihad than math problems. Thank you so very much for your work.
Maybe it´s time to buy the first burqa....
No, NEVER! I will rather die, than live as a dhimmi.
Well, after Lars Vilks drawings, more and more people start to wake up (even)in Sweden - I just hope it´s not too late!
/FS
I have only looked fast at this post (and not read all comments). An exponential growth is correct if you consider the high birth rate, *but* this too simple future projection on the numbers of Muslims -- even if I like that you try to figure out something no one even mention today -- is not valid. Within a generation just about twice as many young Muslim than the number of parents will be added (at 4-5 children per woman). This upon high immigration which gives a strong kind of constant growth.
If the birth rate is constantly very high I think the Muslim population can be about 1/3 of the Swedish population 2050 which is some millions and far more than half the population year 2100. But if birth rate it slows down drastically the coming decades I guess that 2050 about 1/5 of the Swedes will be Muslims and 2/5 at the end of the century. (I actually wrote an Excel sheet on this a time ago were also changes in birthrate is included, because I was curious and I haven't seen any projection yet...)
Of course the scenario with falling birthrate also means a huge change (highly driven by immigration). I think a problem with this fast change in Sweden (and Norway for sure) is that assimilation focused integration becomes impossible and that Muslim enclaves can't be avoided. For the Muslims I guess that is no problem if the societies in the Swedish society serves as an ideological base in the struggle to finally islamize us. I think we already can see this, and that it follows a pattern from some other western countries. But the changes in Sweden is and will be much more dramatic.
Post a Comment